|
在复杂的光学系统中,定义和测量最佳焦点和光轴是非常困难的。只有在整个视场内进行离轴测试才能确定可以得到最佳像质的配置。例如,由于倾斜造成的彗差通过调整补偿通常是可以接受的。但是这种方法对离轴的像面质量却没有改善。
Among the most difficult things to define and measure for complex optical systems are best focus and optical axis. Only with the help of off-axis measurements over the full field is it possible to define the configuration that gives best images over the whole field. For example, it is generally accepted that coma due to tilt can be compensated by decentering the element, but this approach does not always produce desirable results for off-axis images.5
我们采用Spot Optics的波前测试系统对一个复杂f/4的数码相机镜头进行测试,该镜头在平行光束、广角位置有20多个光学面。并与理论测算的结果进行对比如图2 。虽然我们的软件可以测得许多参数,这里仅仅对MTF和泽尼克系数进行对比说明。
We used our instrument to test a complex f/4 digital zoom camera lens with more than 20 optical surfaces in parallel light at wide-angle position, and compared the measurements with the theoretical predictions (see Fig. 2). Though many parameters are available from the software, we focus here only on two: MTF and the Zernike coefficients.
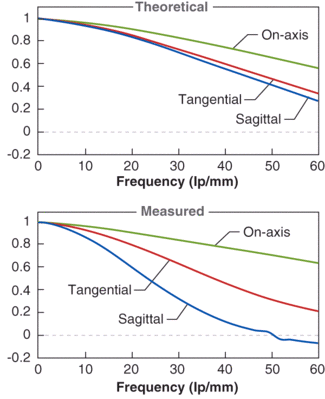
FIGURE 2. The theoretical MTF on-axis and at an off-axis angle of 28º, tangential and sagittal (top), is compared to the values measured with the Shack-Hartmann sensor (bottom). See table for the Zernike coefficients.
上图为理论的近轴MTF和离轴28 º位置的切线方向和弧矢方向的MTF下图为波前测量系统的实际测量结果。泽尼克系数可参看下表
Click here to enlarge image
在60 lp/mm 位置处的MTF值分别是近轴0.56, 切线方向0.34,弧矢方向0.27,相应的测量结果分别为0.64,0.21,和-0.073。这说明,相对于设计的模型,该镜头具有较大的离轴散焦和其它像差。然而,仅从MTF值无法推断何种原因导致的,必须借助全面的泽尼克分析。
The theoretical MTF values for a frequency of 60 lp/mm are 0.56 on-axis, 0.34 tangential, and 0.27 sagittal. The corresponding measured values are 0.64, 0.21 and -0.073, respectively. This shows that the lens has a much larger off-axis defocus and other aberrations compared to that predicted by the model. However, from MTF measurements alone it is not possible to infer what is causing this drop: one needs the full Zernike analysis.
有趣的地方是,该镜头近轴中心位置的MTF高于该模型的设计值,说明在中心位置的光学质量超过设计的规格。这一点可以由所测到的较低的球差值印证(下面的内容会讨论到)。
One interesting point to note is that in the center the measured on-axis MTF exceeds that predicted by the model, indicating that the quality in the center exceeds the specs. This is confirmed by the lower value of the measured spherical aberration, as discussed below.
上面的测试是在650nm波长进行的。通过更换滤光片并重新校正系统的方式,可以在任意波长进行测试。The measurements above refer to a wavelength of 650 nm. They can be made at any other wavelength by using a filter. Recalibrating the instrument is easy for any wavelength, because of the efficacy of the combine algorithm.
通过将测试得到的5个位置的标准泽尼克失常系数(3阶彗差、球差、散光)与设计的理论值进行比较,计算得到与最佳焦面的散焦偏离量(um)。需要特别说明的是,我们的软件是通过数学计算的方法得到散焦偏离量的,没有任何物理扫描的过程,与MTF的测试方法完全不同。
We compared the standard Zernike aberration coefficients (third-order coma, spherical aberration, and astigmatism) measured at five positions with the theoretical values from the model (see table). We also calculated the defocus shift in microns, from flat image plane to best focus. It is worth noting that the defocus shift computed by our software mathematically accounts for all the aberrations; no physical scanning is involved, unlike MTF measurement systems.

近轴设计的球差是-44nm,但是测到的值是-18nm,实际镜头性能超越设计值(如同MTF值体现的一样)。当然,离轴的情况就不一样了。这个测量得到的信息对分析加工生产过程的问题非常有用,例如可相应的修正非球面透镜,或者加衬,修正元件之间的间距等等。
The design value of on-axis spherical aberration is -44 nm, while the measured value is -18 nm; thus, the actual lens performance exceeds the design value (as already noted for the MTF). However, at other off-axis angles, it is much more. This information can be useful for analyzing whether the problem is in production, such as incorrect shape of an aspherical lens, or in the mounting, such as incorrect spacing of the elements.
中心位置的彗差并非零值,说明各光学元件对准不理想,散光是对准和应力综合作用的结果。此外,彗差和散光在光轴周围呈非对称性分布,对于该复杂镜头,这说明,除了离轴的像差是导因之外,个别透镜单元未对准以及透镜组都造成了该像差。
The nonzero value of coma in the center indicates the presence of misalignment of the optical elements, while that of astigmatism is due to a combination of misalignment and stress. Moreover, both coma and astigmatism are nonsymmetrically distributed with respect to the optical axis. For such a complex lens, this indicates that apart from the contribution of off-axis aberrations, misalignment of the individual lenses and groups of lenses are making a significant contribution to the aberration field.
本文讨论的内容强调了在整个成像区域优化镜头的必要性,由于缺乏测试手段,直到目前还是不可能的。通过进行全区域分析得到的反馈信息对分析加工和装配过程中的问题是一个功能强大和必须的工具。可以节省相当的时间和金钱。当然,我们这里讨论的是一个数码相机的镜头,该系统还可以用于手机摄像头镜头,光刻镜头、远心透镜以及监控镜头测试,以及其它复杂光学系统,如HUD等。
This discussion underscores the need to optimize lens performance over the whole image field, which was not possible until now because of the lack of measuring instruments. Feedback from such a full-field analysis can be a powerful and indispensable tool for analyzing problems both in production and in mounting, leading to considerable savings in time and money. While we focused here on a digital camera lens, we have used such systems for testing mobile-phone camera lenses, telecentric lenses at 308 nm, and TV lenses.
REFERENCES
1. R.K. Bhatia, A. Ciani, P. Rafanelli, Proc. SPIE 1994, 68 (1993).
2. R.K. Bhatia, A. Ciani, Proc. SPIE 3134, 167 (1997) (also in: Selected SPIE Papers on CD-ROM Vol. 3 and Optical Testing, Ed.: Daniel Malacara-Hernandez, Vol. CDP03 (1999).
3. R.B. Shack and B.C. Platt, JOSA 61, 656 (1971).
4. R. Wilson, F. Franza, L. Noethe, J. of Modern Optics 34, 485 (1987).
5. R.K. Bhatia, Proc. SPIE 2479, 354 (1995).
|


 解决方案
解决方案